User Manual
Table of contents
- Types of 2D SSE diagrams in the 2DProts database
- Searching the 2DProts database
- 2DProts output pages
- Custom entry 2DProts multiple picture
- Filtering PDB entries
Types of 2D SSE diagrams in the 2DProts database
The 2DProts database contains three types of diagrams: the 2D SSE domain diagrams, the 2D multiple SSE family diagrams, and the 2D SSE protein diagrams.
2D SSE diagram of individual protein domains
A 2D SSEs diagram of a domain visualizes the relative distance between SSEs, as well as the position of amino acids that comprise each element in the amino acid chain of the domain.
The 2D diagram contains two types of symbols that represent secondary structures:
- an arrow, which represents a strand
- a bar, which represents a helix
Both symbols can be colored in two ways:
- Using rainbow colors, which are used for SSEs occurring in more than 80% of domains in its family. The exact color of an SSE depends on its position in the domain. The color spectrum starts on blue (the start of the sequence that represents the domain) and goes through green, yellow and orange to red (the end of the sequence that represents the domain).
- Using grey, which is used if the SSE is a part of less than or equal to 80% of proteins in the protein family.
On the right, you can see an example of a 2D diagram of domain 1aomB02.

2D multiple SSE diagram of protein families
2D multiple SSE diagrams show 2D SSE diagrams of all domains of a protein family in one picture. Diagrams of individual protein domains are rotated and moved to similar positions.
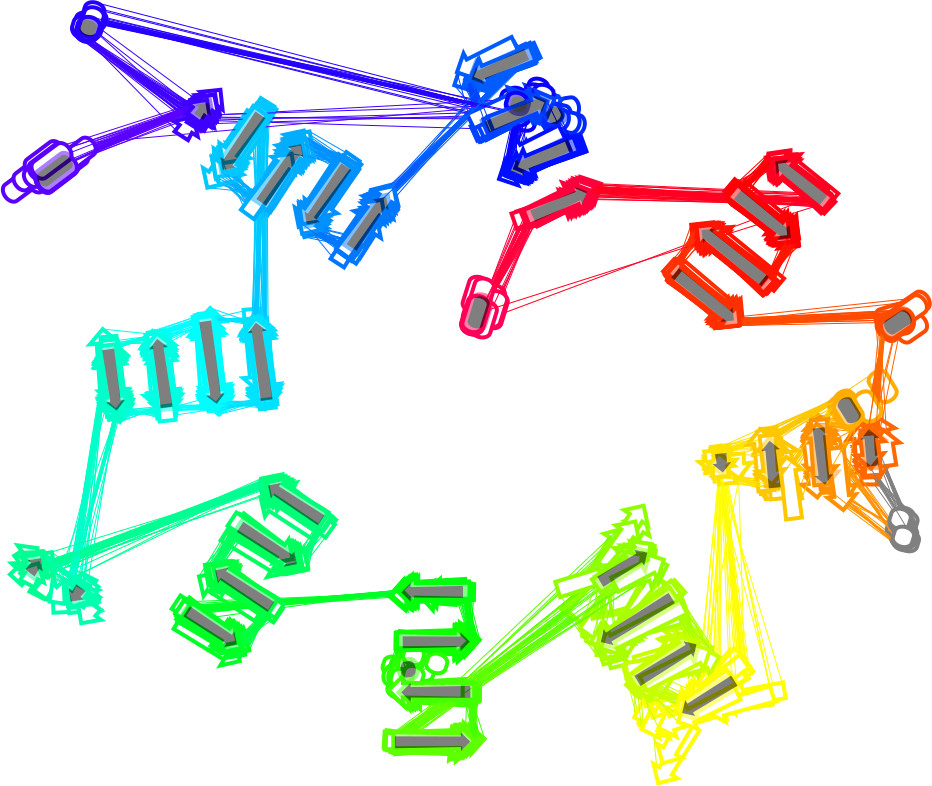
There are four types of 2D multiple SSE diagrams in the 2DProts database.
"Transparent" (Default)
In the default type of 2D multiple SSE diagram, each domain 2D SSE diagram is shown with some level of transparency. Therefore, the unstable parts (the parts which occur in a small portion of domains from the given family) are less visible. The major impact is for families with a lot of domains.
The average domain is shown as well. It contains SSEs which are in at least 80% of domains in the given family. The position and orientation of each SSE are computed as an average through all domains that contain this SSE. The average domain is visualized using filled dark grey SSEs – arrows and bars.
The example on the right shows the first type of the multiple 2D diagram for protein family 2.140.10.20.

"Opaque"
In the third type of diagram, all domain diagrams are shown with 100% visibility. Therefore, the 2D multiple SSE diagram of this type shows also structures that are present only in a small portion of family domains.
The average protein is shown as well. It contains SSEs which are in at least 80% of protein domains in the family. The position and orientation of each SSE are computed as an average through all domains that contain this SSE. The average protein is visualized using filled dark grey SSE symbols (arrows and bars).
The example on the right shows the fourth type of the multiple 2D diagram for protein family 2.140.10.20.
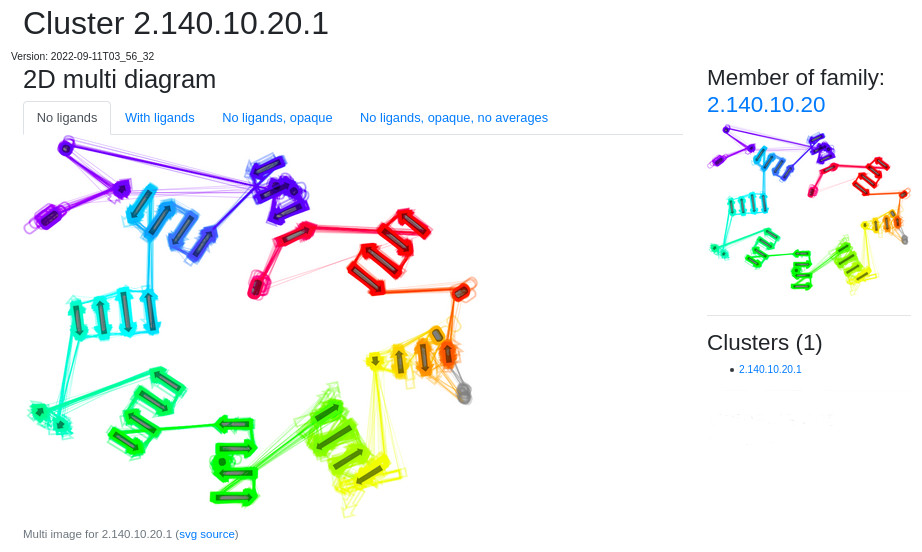
"Opaque, no averages"
In the third type, all domain diagrams are shown with 100% visibility. Therefore, 2D multiple SSE diagrams of this type show structures that are present only in a small number of domains visible in a standard way. The average protein structure is not shown
The example on the right shows the third type of the multiple 2D diagram for protein family 2.140.10.20.

2D SSE diagram of individual proteins
A 2D SSEs diagram of a protein visualizes the relative distance between SSEs, as well as the position of amino acids that comprise each element in the amino acid chain of the domain.
The 2D diagram contains two types of symbols that represent secondary structures:
- an arrow, which represents a strand
- a bar, which represents a helix
Both symbols can have color corresponding to the chain to which the SSE belong.
The example on the right shows the third type of the 2D diagram for protein 1orw.
Searching the 2DProts database
Each protein domain is represented in the 2DProts database via its identifier in the CATH format (e.g., 1r9nA01), and its 2D diagram is searchable using this identifier. It is also possible to search for all domains of a specific protein using its PDB ID (e.g., 1r9n). The search field of the 2DProts database also accepts substrings that are at least 3 characters long (e.g., 1r9n, 1r9, r9n).
Protein families are also represented in the 2DProts database via a CATH identifier (e.g., 2.140.10.20) that can be used in the search field to obtain a multiple 2D diagram of a family. Substrings that are at least 3 characters long are also supported (e.g., 2.140.10, 2.140, 140.10.20).
2DProts output pages
2D diagram of individual protein domains page
2DProts output page for each domain contains four parts
- diagram for the given domain (on the left main part)
- name and 2DProt diagram of the family to which the domain belongs (on the right part, on the top)
- name and 2DProt diagram of the protein to which the domain belongs (on the right part, in the middle)
- links to old versions of diagrams of this domain (on the right part, on the bottom)

Multiple 2D diagram of whole families page
2DProts output page for each family contains five parts
- multiple diagrams for the given family (on the left main part)
- CATH 3D diagram of the given family (on the right part on the top)
- name of all domains which belong to the given family (on the right part in the middle)
- name of all clusters which belong to the given family (on the right part in the middle)
- links to old versions of diagrams of this domain (on the right part at the bottom)

Multiple 2D diagram of whole clusters page
2DProts output page for each family cluster contains three parts
- multiple diagrams for the given family cluster (on the left main part)
- name and 2DProt diagram of the family to which the domain belongs (on the right part in the middle)
- links to old versions of diagrams of this domain (on the right part in the middle)
Custom entry 2DProts multiple pictures
In the section "Custom entry" you can create a custom multi-image from provided domains. All the domains in their latest version have to be from one family.
Filtering PDB entries
See RCSB filtering guide (PDF, 600 kB) for information on filtering PDB entries by experimental method and resolution using RCSB advanced search.